Have The Number Of Families Under Poverty Increased In Gujarat?
Former Madhya Pradesh Chief Minister Digvijay Singh recently tweeted, “Modi lacking in ideas. Steals Congress slogan of Garibi Hatao 1971 Vintage! Would he explain why Families under BPL have increased in Gujarat?” So that’s the question. Have the number of families under Below Poverty Line or BPL indeed increased in the state of Gujarat? The answer is no but let’s put the statement in context. First, the overall poverty numbers for India have come down sharply in recent years. In absolute numbers, India’s number of poor has come down from 407.1 million in 2004-05 to 269 million in 2012. So it is evident that Gujarat must share some of those successes, like other states. Now let’s look at the states with the highest number of BPL residents, according to Planning Commission poverty estimates of 2004-05 and 2011-12. This period also gives you an idea over a stretch of time and from the start to the end of a period of high economic growth.
Figure 1(a)
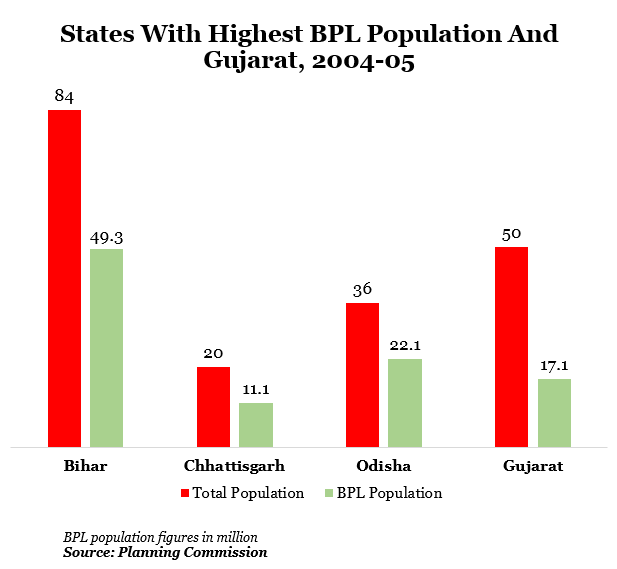
Figure 1(b)
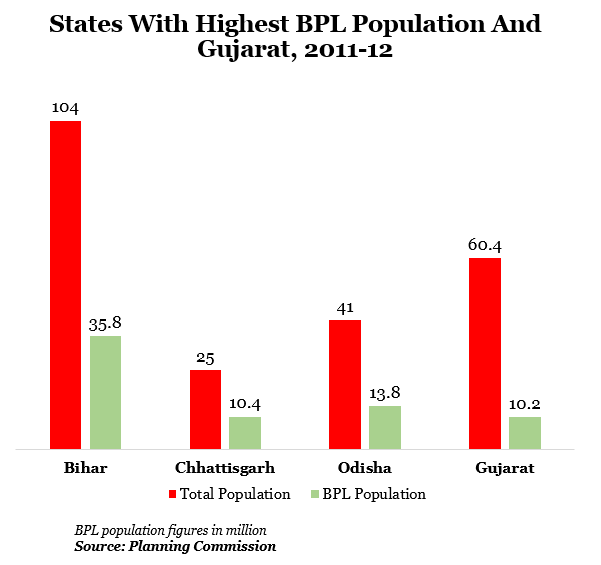 Figure 1(c)
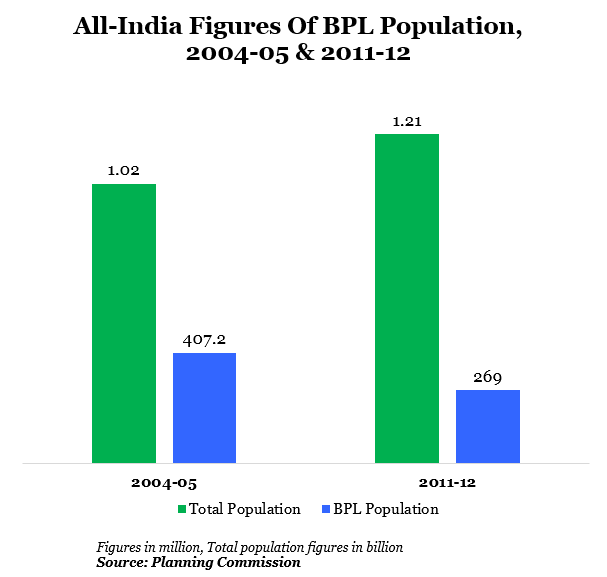
Interestingly, while BPL numbers have not increased in Gujarat (more detail in a bit) it is interesting to see which states have improved their poverty numbers the best. Thus, from this list, it would appear that Bihar has the best record in poverty alleviation, followed by Odisha. This is in absolute numbers. If you look at percentage of population, then it would appear that Odisha leads the list, something we’ve reported on earlier as well.
Figure 1(a&b) also shows that the population under the Below Poverty line has actually declined from 17.1 million to 10.2 million during the 2004-05 to 2011-12, by 40%. Percentage-wise the BPL population has come down from 31.6% in 2004-05 to 16% in 2011-12. This appears to contradict the statement made by Congress Party leader Digvijay Singh.
In fact, Gujarat does not even feature among the 5 states with the highest BPL population. The highest, is Bihar with 35% of its population living below poverty line.
Now we look at Figure 2(a&b), where we can compare the BPL rates for India and Gujarat. We can see that the poverty decreased by 33% at all India level in 2004-05 to 2011-12 while it decreased by 40% in Gujarat (which was higher than the national average) during the same time.
Figure 2(a)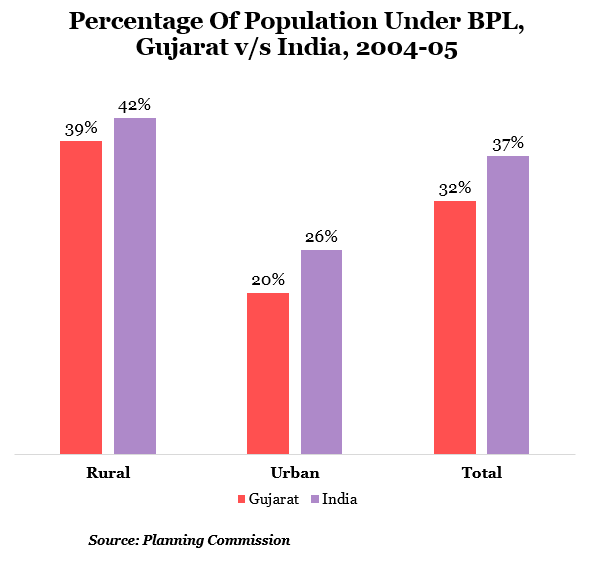
Figure 2(b)
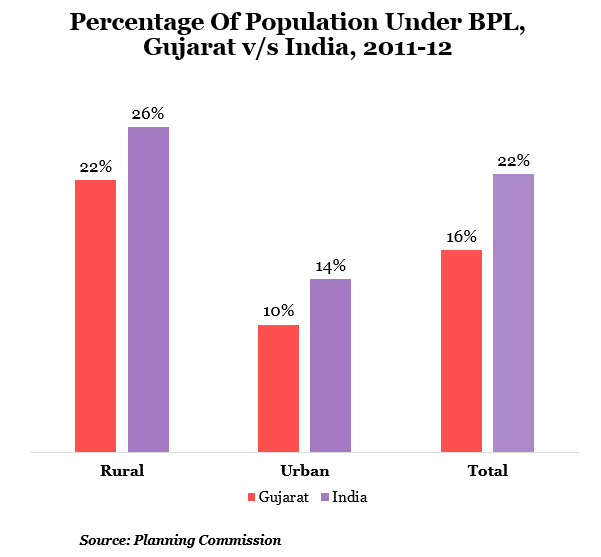
Rural poverty decreased by 33% at the all-India level but in Gujarat it decreased by 41 %. Urban poverty at a national level has declined 34% while in Gujarat it declined 38%.
Digvijay Singh also tweeted that “Gujarat stands 19th in State Ranking below National Average!” when it comes to the average mean per capita expenditure urban. This would suggest that urban residents of Gujarat or ranked 19th when it comes to monthly spending on necessities. Another way of looking at buying power or income.
This number is somewhat accurate because Gujarat is actually 21st and does have an average monthly per capita expenditure (urban) below the national average. The reasons for this could of course be many and include differences in savings behavior (annual household savings rate is 34% for Gujarat while national savings rate is 30% for India). And has been documented by IndiaSpend in the past.
Table 1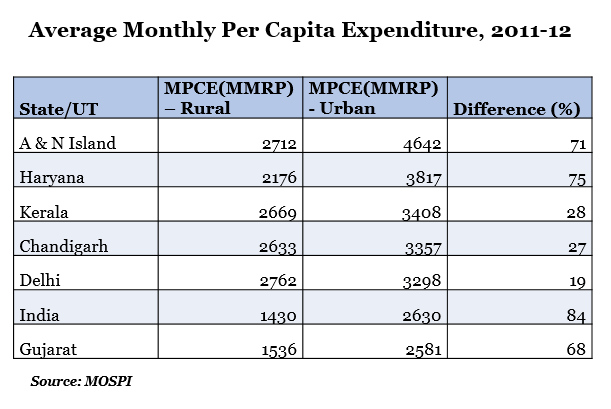
There are a few other interesting things that can be noticed from this data set:
"text-align:justify;">Gujarat stands 24th in average rural MPCE in the country and that the MPCE difference between rural and urban expenditure is 68%. This shows that people in rural Gujarat spend 68% less on monthly expenditure than their urban counterparts while the all India average is higher 84%, which means that for every Rs. 168 spent by an urban resident the rural counterpart will spend only Rs.100. This shows that average rural Indian spends 84% less on monthly expenditure than urban areas. That’s a larger consumption, savings story of course.