Govt Claims Delhi’s Air Is Cleaner, But There’s No Way To Know That
New Delhi: Environment minister Prakash Javadekar recently submitted data in parliament that suggested Delhi’s air has become cleaner as the levels of key pollutant PM 10 to have dropped 20% from 278 µg/m3 (micrograms per cubic metre) in 2016 to 223 in 2018. In June 2019, the minister had claimed that the number of days Delhi experienced 'poor' air quality was down 33% over the preceding four years.
The July 12, 2019, response listed the measures that Delhi has taken to fight air pollution, and suggested that they were working at least to the extent of reducing the levels of particulates--PM 10 refers to particulate matter measuring 10 micrometres or less; particulates can enter the lungs and the bloodstream and cause a range of health problems. Delhi’s levels of PM 2.5 (particulate matter smaller than 2.5 microns) were also shown to have fallen from 2016 to 2017, and then risen slightly in 2018.
If true, this would be welcome news for not only the residents of India’s infamously polluted capital city, but also for policymakers and those in-charge of implementing it, bearing encouraging signs for the rest of India that pollution control efforts are working.
But do the data bear out this conclusion?
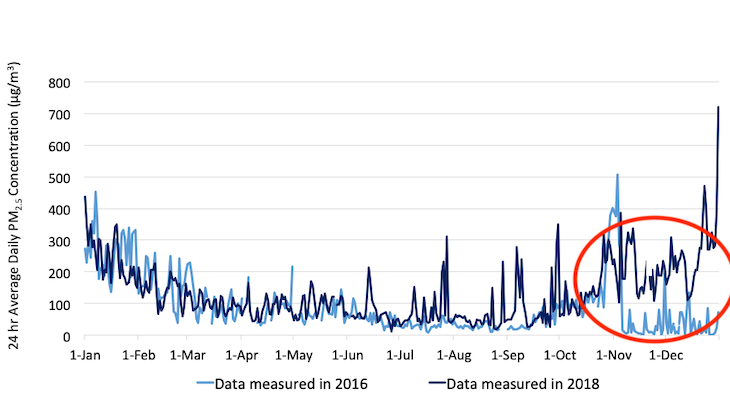
We used publicly available monitoring data from the Central Pollution Control Board (CPCB)--24-hour average concentrations of fine particulate matter (PM 2.5) from January 1, 2016, to December 31, 2018--to measure how much air quality levels had changed in Delhi during this period. We focused on two broad questions.
- Can we compare outcomes across years using government monitoring data?
- Given data constraints, what can we say about whether and how much air quality has improved in Delhi between 2016 and 2018?
Do the monitoring data allow comparisons across years?
To compare air quality levels across the years, we would ideally compare across a consistent group of monitors, relaying reliable measurements regularly throughout the period.
Air pollution varies significantly with season: the winter sees very high particulate matter levels, which improve during the summer, and clear up during the monsoons. In addition, air quality levels can differ substantially within a city. Figure 1 shows the annual average of 27 monitors in Delhi that had data available for more than 90% of the days in 2018. Annual PM 2.5 concentrations varied from about 2-times the Indian standard to 3.6-times. Given this range, comparing information across different sets of monitors across different years can lead to erroneous conclusions.
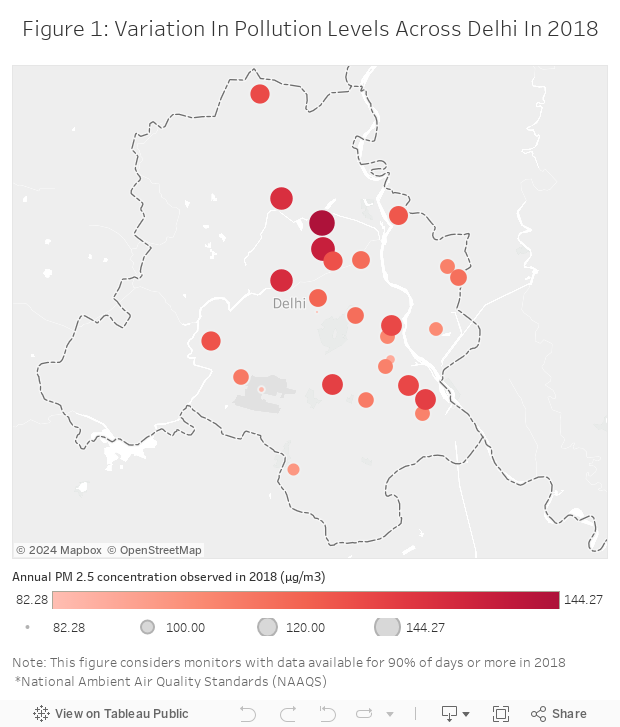
Figure 2 shows large gaps in the monitoring data in 2016 and 2017. Not a single monitor had data available for every month in this period.
However, Figure 2 also shows that Delhi has substantially expanded its monitoring network in this period: in 2018, 37 monitors measured Delhi’s air quality, with data from 27 of these available 90% of the days. Compare this to 11 monitors in 2016, of which only two were available 90% of the days.
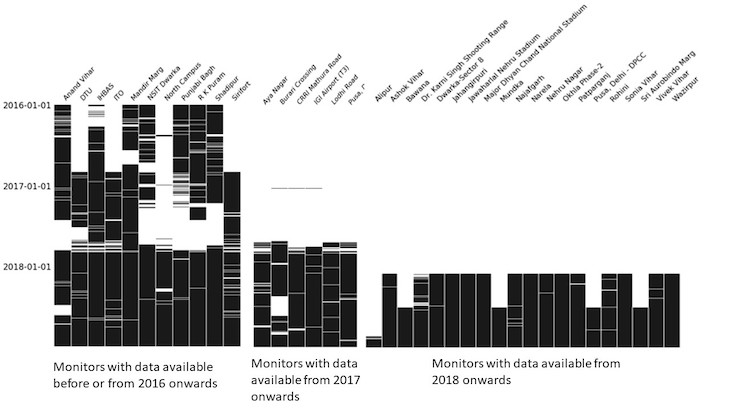
Note: The white spaces in the middle of the columns indicate missing data.
Missing data make historical comparisons difficult. Since pollution levels vary substantially both by season and by monitor, statistical parameters such as annual averages can get skewed one way or the other, making comparisons meaningless.
Therefore, we need to restrict ourselves to monitors sending regular measurements throughout the year. As Table 1 shows, not many monitors have adequate data availability in any two years we need to be able to compare, and none in all three.
| Table 1: Data Availability Across Monitors From 2016 To 2018 In Delhi | |||
|---|---|---|---|
| Year(s) | Monitors With Data Available At Specified Levels,Out Of Total Monitors At The Time | ||
| More than 90% of days | More than 80% of days | More than 70% of days | |
| 2016 | 2 / 11 # | 4 / 11 | 7/ 11 |
| 2017 | 1/ 17 # | 4 / 17 | 5 / 17 |
| 2018 | 27 / 37 | 31 / 37 | 32 / 37 |
| Both 2016 and 2017* | 0 / 11 | 0 / 11 | 2 /11# |
| Both 2016 and 2018* | 2 / 11 | 4 / 11 | 7/ 11 |
| Both 2017 and 2018* | 1 / 17 | 4 / 17 | 5 /17 |
* Monitors with data availability at levels mentioned in each of these two years
# RK Puram and Shadipur had >90% availability in 2016 and 2018, and Mandir Marg in 2017 and 2018. For 2016-17, no monitors had more than 80% availability both years, with IHBAS and Mandir Marg at >70% in both 2016 and 2017.
To measure how pollution levels changed between 2016 and 2018, we can only compare across monitors with reasonably high data availability in each of these years. No monitor is available for more than 80% of the days in all three years. As a second-best approach, we compare between pairs of years using groups of monitors with high data availability in each of the two years being compared.
Has air quality improved in Delhi?
Let us consider monitors with 80% availability or more in each of the years being compared. With this threshold, Table 1 shows that there is no monitor available to compare 2016 and 2017. To compare the other two pairs of years (2016-18, and 2017-18) the missing data force us to rely on two entirely distinct groups of four monitors (see Figure 3).
Using the annual average PM 2.5 concentration as our indicator, and the 80% availability condition above, Figure 3 shows how pollution levels in 2018 seem to be similar or lower than in 2016 in three of the four usable monitors, and similar or higher compared to 2017 in three of the other groups of four usable monitors. The extent, and even the direction, of change varies among these monitors.
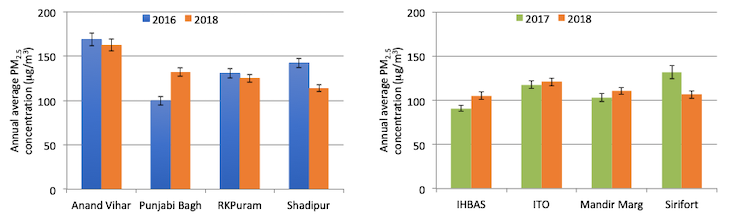
Note: Error bars show the standard error in calculating the average
Even if data are available, there are also unreliable observations with unusually low or high values. Take the case of Punjabi Bagh, which shows an increase in pollution levels in 2018, compared to 2016 (Figure 3). This finding is driven largely by erroneously reported values as low as 2 µg/m3 , and lower than 14 for half the time, in the last two months of 2016 (see Figure 4).
The analysis above demonstrates the various challenges to conclusively determine the extent of pollution reduction. Data constraints make inter-year comparisons difficult, forcing us to rely on a handful of monitors.
Furthermore, to end with a single estimate of Delhi-wide change, we would want to aggregate the data in a manner “representative” of Delhi. How could we aggregate data here in a manner that reflects the population distribution, and therefore exposure to pollution, in the city? How do we treat areas which do not have sufficient or any monitoring data at all?
To go further and assess the impact of government efforts, we would also need to account for how much differing meteorological conditions across the years affected observed air quality levels. All of these necessitate careful, scientific analysis.
Way forward
A good start would be for the CPCB to be transparent about the analysis it uses to back any official claims on air quality improvement, explicitly addressing challenges such as those outlined above.
In addition, regulatory and academic experts need to establish a systematic way to measure changes in air quality going forward, so that there is no subsequent disagreement on facts. To allow for independent verification, air quality data should be made more easily accessible in real time.
With the National Clean Air Programme setting pollution reduction targets for 2024, and the monitoring network in most of India often limited to a single monitor even in large cities (and entirely absent in rural areas), it is important to develop this assessment protocol, and expand monitoring capacity in a manner designed to facilitate such evaluations.
The monitoring network in most parts of the country is still very scarce, and from a few hundred currently, India may need to scale up to around 4,000 continuously measuring monitors.
We end with a word of caution regarding policy implications. Given the difficulty in making conclusive assessments of Delhi’s air quality, we must be wary of ascribing improvements, or the lack thereof, to government policy (assuming we are on track in Delhi) and, even more careful about treating Delhi as a success worth emulating nationwide.
As air pollution control efforts accelerate in the rest of India, it is important to increasingly tackle pollution at a regional, “airshed” level, tackle each major source, and better prioritise mitigation measures to focus government efforts. And, in parallel, improve the data available to make better decisions, and track progress systematically and transparently.
(Harish is a fellow at the Centre for Policy Research. Selvaraj and Dholakia are research analyst and senior research associate, respectively, with the Council on Energy, Environment and Water. The authors thank Karthik Ganesan, Pallavi Pant and Sarath Guttikunda for their review comments.)
We welcome feedback. Please write to respond@indiaspend.org. We reserve the right to edit responses for language and grammar.