New: Assess Constituencies By Health, Education And Economy
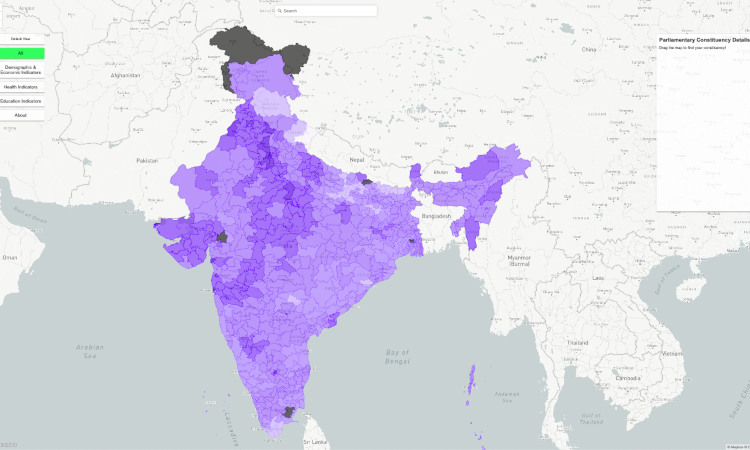
Click to view the interactive map on Constituency Check.
Hyderabad: With the first phase of polling set to begin tomorrow, FactChecker has launched a new portal, Constituency Check, to analyse the performance of Lok Sabha constituencies on select health, education and economic indicators.
Besides providing an overall picture, the interactive portal can also be of assistance to monitor progress in each constituency. While various surveys document the performance of villages, block, districts and states, there are no official surveys at the Lok Sabha constituency level. This is an attempt to fill this gap.
Data for the portal have been extracted from the National Family Health Survey, 2015-16 (NFHS-4), the 71st round of the National Sample Survey (2014), and the Unified District Information System for Education (U-DISE), 2016-17.
While a Lok Sabha constituency may span multiple districts, state assembly constituencies do not. First, district-level data were matched with state assembly constituencies. Since Lok Sabha constituencies comprise several assembly segments, data derived for the latter were extrapolated to the former.
Since the sampling can vary across and within districts, these data may not match a constituency-level survey if and when conducted, but are indicative to infer where a constituency stands in comparison to the national average.
In the next phase, we will add a module to compare the constituencies’ performance with state averages.
Health indicators
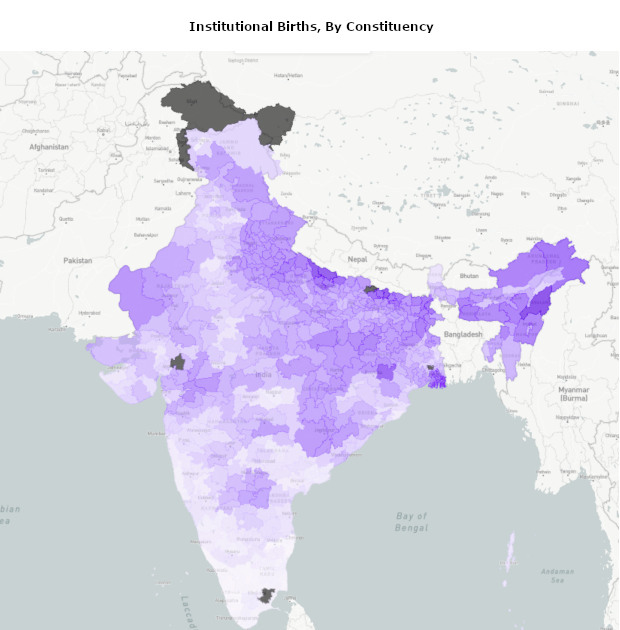
1. Institutional births
Nineteen constituencies, all in Kerala and Tamil Nadu--Ernakulam, Attingal, Thiruvananthapuram, Pathanamthitta, Kannur, Kasaragod, Idukki, Kottayam, Vadakara, Kozhikode, Thrissur, Chalakudy, Alathur, Palakkad, Kancheepuram, Erode, Chennai South, Chennai Central and Vellore--reported 100% institutional births.
The lowest percentage was reported in Nagaland (32.9%), followed by Sitamarhi (37.3%) in Bihar and Bahraich (37.4%) in Uttar Pradesh.
In 2015-16, the national average was 78.9%.
Click to view the interactive map on Constituency Check.
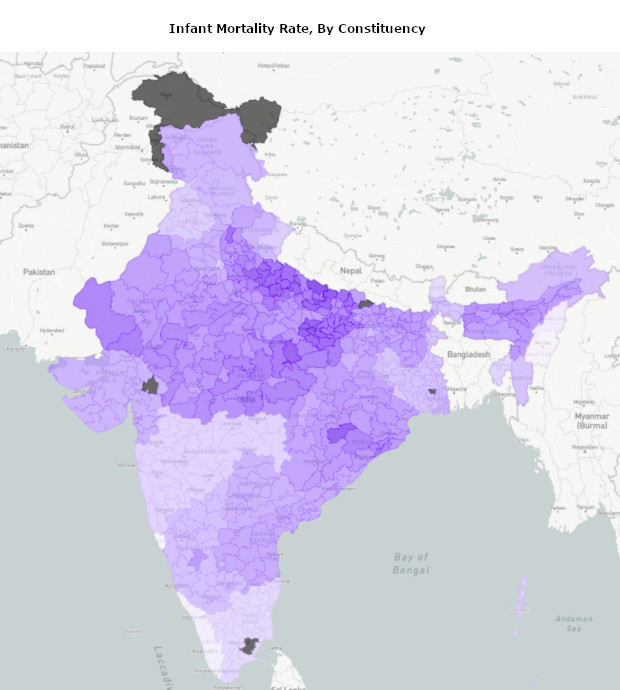
2. Infant mortality rate
Infant mortality rate (IMR) is defined as the number of deaths of children under one year per 1,000 live births.
Shrawasti constituency has the highest IMR (90.6 deaths per 1,000 live births), followed by Domriaganj (87) and Pratapgarh (84). All three are in Uttar Pradesh.
South and North Goa (10), and Inner and Outer Manipur (11) reported the lowest IMR.
India’s National Health Policy, released in March 2017, set a target of reducing infant mortality rate to 28 by 2019. The IMR in 2015-16 was 41, as FactChecker reported in March 2017. As of 2015-16, 188 of 543 constituencies (35%) have an IMR equal to or better than the target.
Click to view the interactive map on Constituency Check.
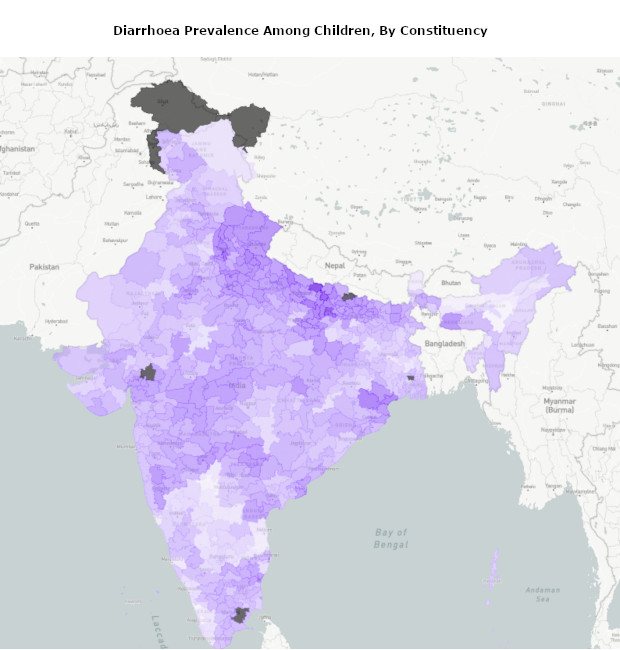
3. Diarrhoea prevalence among children
Diarrhoea among children below the age of five is indicative of sanitation and water quality. NFHS records the prevalence reported by respondents in the two weeks preceding the survey.
Domriaganj (29.1%), Gorakhpur (25.8%) and Ghosi (24.3%)--all in Uttar Pradesh--have the highest diarrhoea prevalence among children. Thrissur (0.8%) and Kottayam (1%) in Kerala, and Autonomous District in Assam (1.2%) reported the lowest prevalence.
In 2015-16, the national average was 9.2%.
Click to view the interactive map on Constituency Check.
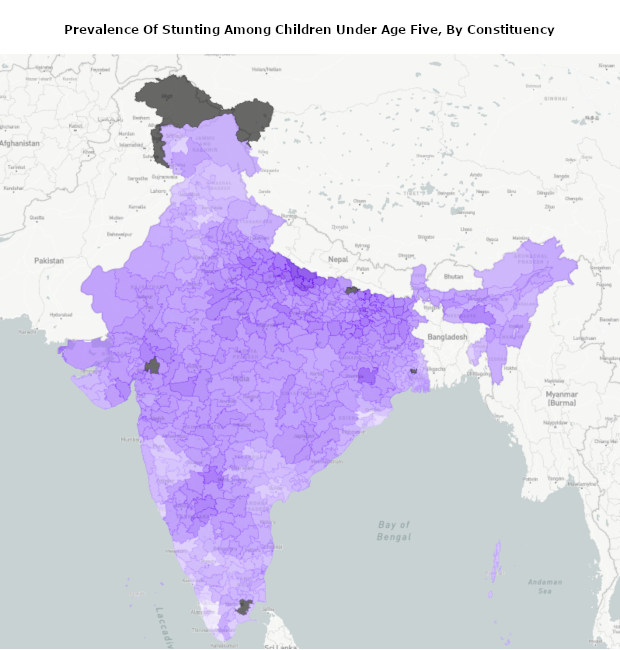
4. Childhood malnutrition
Prevalence of stunting (low height for age), wasting (low weight for height) and underweight (low weight for age) among children under the age of five are proxy indicators for the nutritional status of children.
Bahraich (65.1%), Shrawasti (63.1%) and Kaiserganj (60.2%)--all in Uttar Pradesh--have the highest prevalence of stunting. Ernakulam (12.4%), Idukki and Kollam (14.4%)--all in Kerala--have the lowest prevalence. In 2015-16, the national average was 38.4%.
Click to view the interactive map on Constituency Check.
Jamshedpur in Jharkhand (40.6%), Garhchiroli - Chimur in Maharashtra (38.3%) and Tehri Garhwal in Uttarakhand (36.9%) have the highest prevalence of wasting. Inner Manipur (6.8%), Anantnag in Jammu and Kashmir (7.3%), and Outer Manipur (7.4%) have the lowest prevalence. In 2015-16, the national average was 21%.

Click to view the interactive map on Constituency Check.
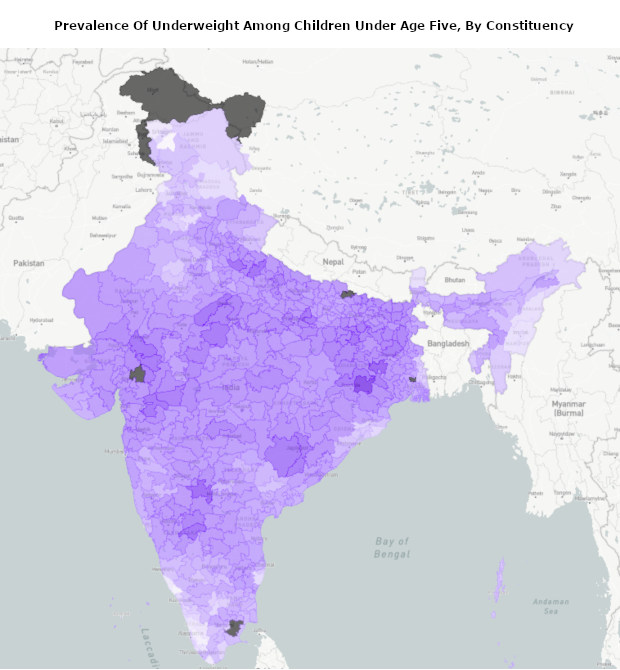
Singhbhum in Jharkhand (64.5%), Puruliya in West Bengal (58.2%) and Gulbarga in Karnataka (55.9%) have the highest prevalence of underweight. Anantnag in Jammu and Kashmir (9.7%), and Kannur (10.5%) and Pathanamthitta (11.3%) in Kerala have the lowest prevalence. In 2015-16, the national average was 35.8%.
Click to view the interactive map on Constituency Check.
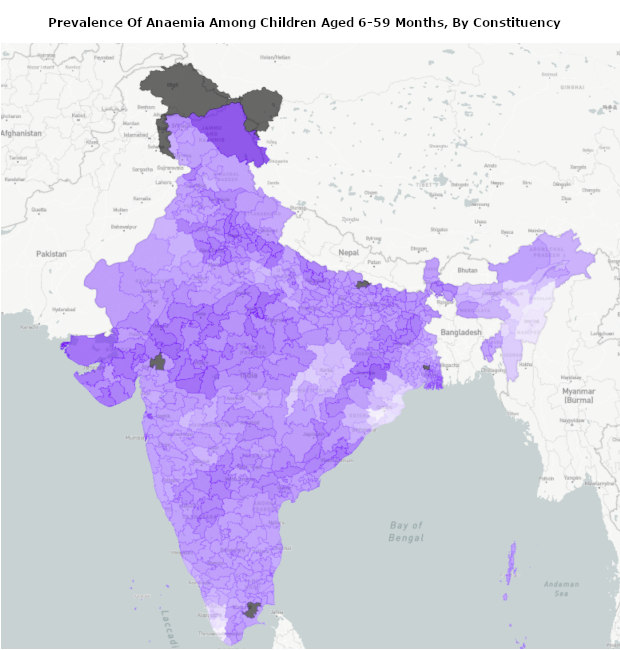
5. Anaemia prevalence among children
Leh (Ladakh) in Jammu and Kashmir (91.7%) has the highest prevalence of anaemia among children aged between six and 59 months, followed by Singhbum in Jharkhand (83.5%) and Banswara in Rajasthan (81.4%).
Kollam in Kerala (18.1%), and Bhubaneswar (19%) and Cuttack (20%) in Odisha have the lowest prevalence.
In 2015-16, the national average was 58.6%.
Click to view the interactive map on Constituency Check.
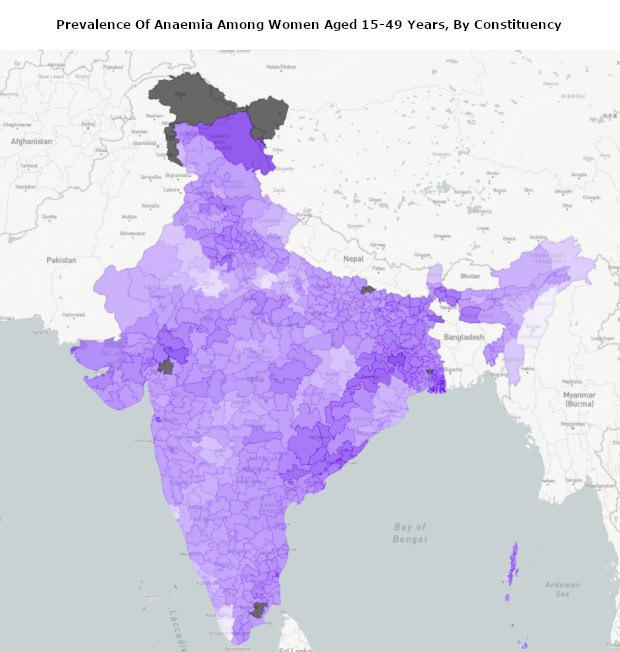
6. Anaemia among women
Puruliya in West Bengal (80%), Leh (Ladakh) in Jammu and Kashmir (78.6%), and Chandigarh (75.9%) saw the highest prevalence of anaemia among women aged 15-49 years. Thiruvananathapuram and Attingal (22.5%) in Kerala, and Nagaland (23.8%) saw the lowest prevalence. In 2015-16, the national average was 53.1%.
Click to view the interactive map on Constituency Check.
Education indicators
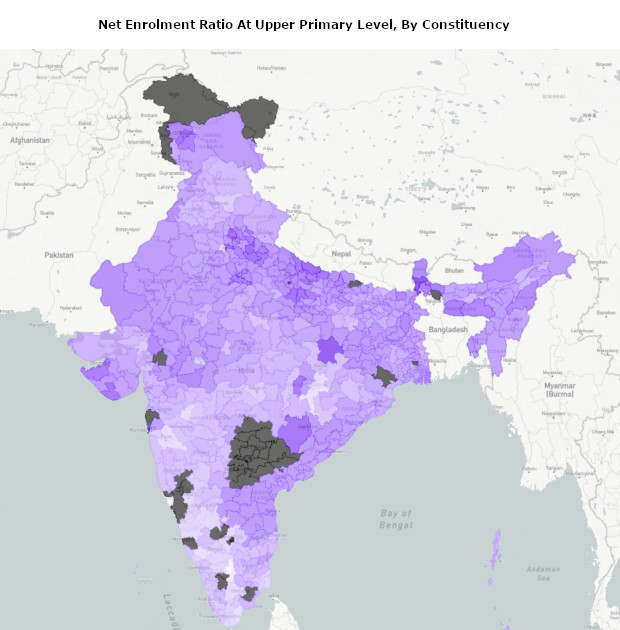
1. Net enrolment ratio at upper primary level
India has been successful in increasing primary school (grades I-V) enrolment to the extent that more than 83% of primary school-age children were enrolled in 2016-17, according to data from the District Information System for Education (DISE).
We looked at the net enrolment ratio at the upper primary level (grades VI and VII) to understand if this near-universal school education enrolment is continuing through the elementary level. Net enrolment ratio (NER) is defined as the percentage of children in the corresponding age-group enrolled in upper primary school.
Tiruppur (99.9%) in Tamil Nadu, South Goa (99.2%), and Erode (96.7%) in Tamil Nadu have the highest NER in upper primary school, while Mumbai South-Central Mumbai North-West, Mumbai North-East and Mumbai North-Central (20.3%) have the lowest enrolment rate.
Click to view the interactive map on Constituency Check.
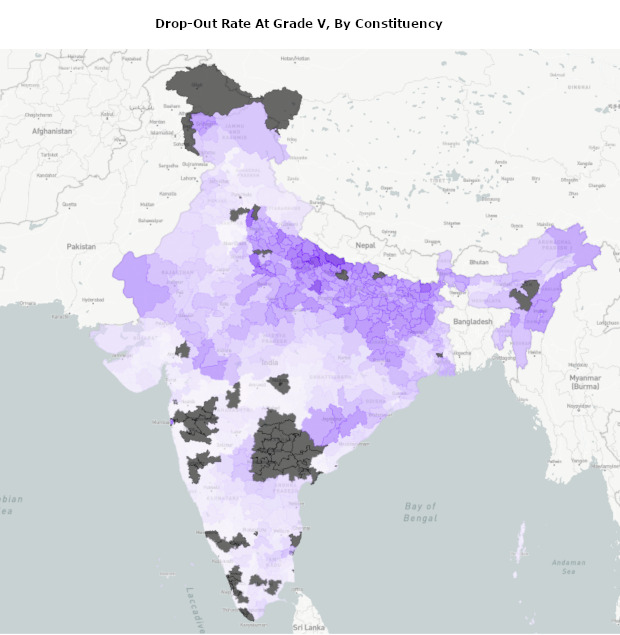
2. Drop-out rate at grade V
Shrawasti (47%), Sitapur (44.8%) and Rae Bareli (43.4%)--all in Uttar Pradesh--reported the highest dropout rate at grade V. Akola in (0.01%), Bangalore North (0.05%) and Bhiwani-Mahendragarh in (0.08%) reported the least.
Click to view the interactive map on Constituency Check.
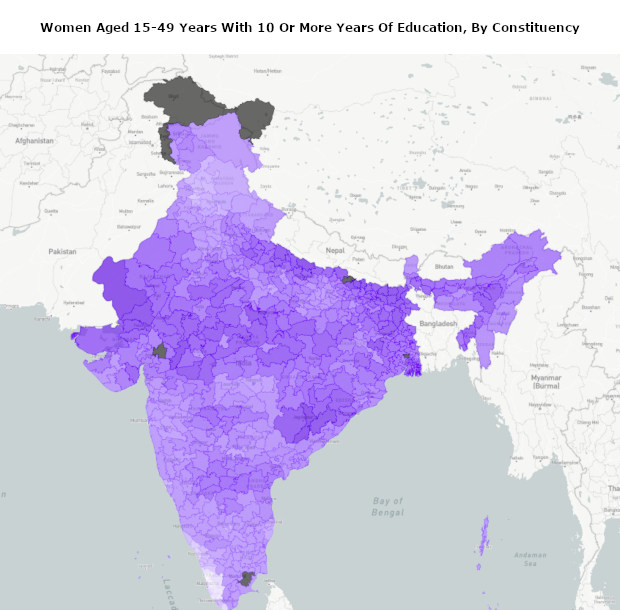
3. Women with 10+ years of education
Ernakulam (83%), Kottayam (81.6%) and Chalakudy (80.1%)--all in Kerala--have the highest percentage of women aged 15-49 years with 10 or more years of education.
Barmer in Rajasthan (10%), Shrawasti in Uttar Pradesh (11.5%) and Nabarangapur in Odisha (11.5%) have the least percentage.
In 2015-16, the national average was 35.7%.
Click to view the interactive map on Constituency Check.
Demographic and economic indicators
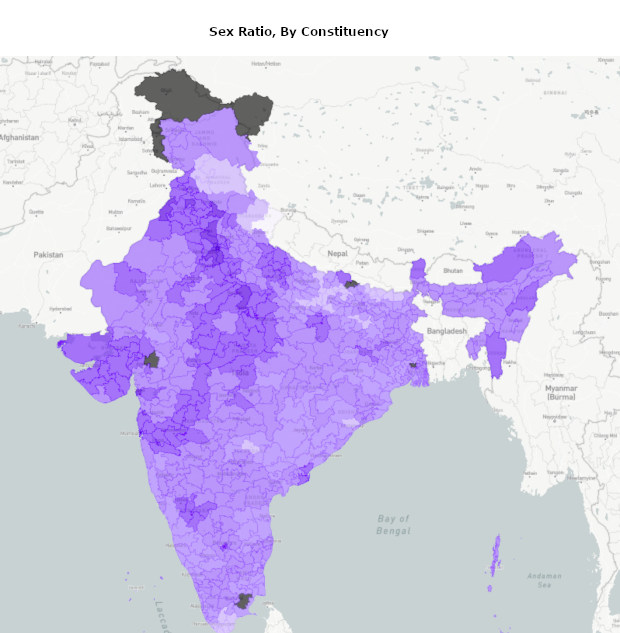
1. Sex ratio
Almora in Uttarakhand has the highest sex ratio in the country, at 1,173.3 females per 1,000 males, followed by Garhwal in Uttarakhand (1169.6) and Sivaganga in Tamil Nadu (1160.3).
New Delhi has the lowest sex ratio (836), followed by South Delhi (836) and Ambala in Haryana (838.3)
India has a sex ratio of 991 females per 1,000 males in 2015-16.
Click to view the interactive map on Constituency Check.
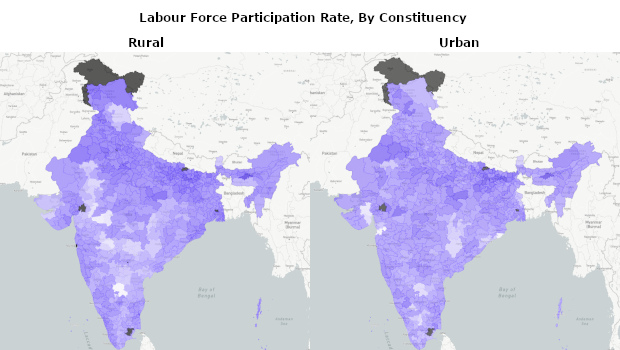
2. Labour force participation rate
Labour force participation rate (LFPR) is the proportion of population involved in economic activity. It is defined as the number of person ages 15 and above who are working or are actively seeking work per 1,000 persons.
For the purpose of this portal, we have expressed this number in percentage.
Anantapur and Hindupur in Andhra Pradesh have the highest rural LFPR (87.1%), followed by Khargone in Madhya Pradesh (84.9%). Guwahati has the lowest rural LFPR (27.2%), followed by Maharajganj (34.5%) and Saran (34.1%) in Bihar.
India has a rural LFPR of 53% in 2015-16, according to the Fifth Annual Employment - Unemployment Survey, 2015-16.
For urban areas, Valsad in Gujarat has the highest LFPR (70.7%), followed by Jagatsinghpur in Odisha (70.6%) and Surendranagar in Gujarat (67.8%). Madhepura in Bihar (30%) has the lowest urban LFPR, followed by Guwahati in Assam (30.3%) and Arrah in Bihar (33.8%).
India has an urban LFPR of 43.5% in 2015-16.
Click to view the interactive map on Constituency Check.
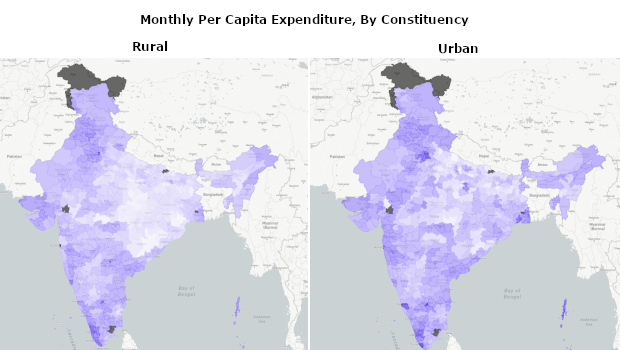
3. Monthly per capita expenditure
Monthly per capita expenditure (MPCE) is an indicator of economic consumption. South Delhi constituency has the highest rural MPCE (Rs 3,495.8), followed by Kottayam (Rs 3,096) and Ernakulam (Rs 3,047.8) in Kerala.
Mayurbhanj (Rs 691.5), Nabarangapur (Rs 702.1) and Kalahandi (Rs 714.5), all in Odisha, have the lowest rural MPCE.
For urban areas, Gautam Buddha Nagar (Rs 4,593.2) in Uttar Pradesh has the highest MPCE, followed by Attingal and Thiruvananthapuram (Rs 4,563.8) in Kerala. Kheri (Rs 893.6), Barabanki (Rs 910.5) and Rampur (Rs 987.6), all in Uttar Pradesh, have the lowest urban MPCE.
Click to view the interactive map on Constituency Check.
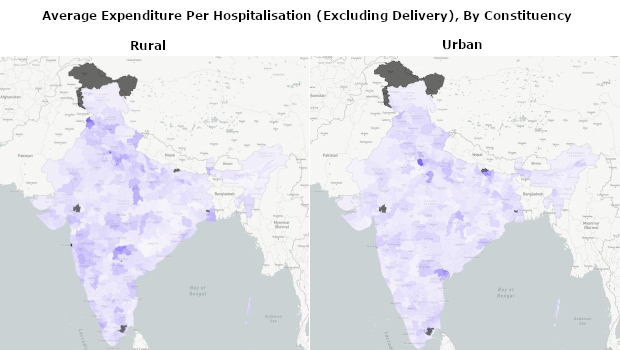
4. Average expenditure per hospitalisation (excluding delivery)
Amritsar reported the highest hospitalisation expenses in rural areas (Rs 1.27 lakh) followed by Chandni Chowk (Rs 1.09 lakh) in Delhi and Nizamabad (Rs 93,534) in Telangana.
Tura in reported the lowest (Rs 2,003), followed by Autonomous District constituency in (Rs 2,246) and Bastar in Chhattisgarh (Rs 2,301).
Mathura in Uttar Pradesh (Rs 2.37 lakh) reported the highest expenditure on hospitalisation in urban areas, followed by Purba Champaran in Bihar (Rs 1.67 lakh) and Guntur in Andhra Pradesh (Rs 1.38 lakh). Balurghat (Rs 2,294) and Raiganj (Rs 2,313) in West Bengal reported reported the lowest expenditure, followed by Pratapgarh in Uttar Pradesh (3,255.9).
These are costs reported to the National Sample Survey Office (NSSO), and not every household may have had a case of hospitalisation.
Click to view the interactive map on Constituency Check.
5. Average out-of-pocket spending per delivery in public health facility
Baharampur in Odisha and Jangipur in West Bengal (Rs 31,481) have the highest out-of-pocket expenditure per delivery in a public health facility, followed by Murshidabad in West Bengal (Rs 27,433).
Bastar in Chhattisgarh reported the lowest such expenditure (Rs 513), followed by Morena in Madhya Pradesh (Rs 578) and Sirsa in Haryana (Rs 683).
The national average in 2015-16 was Rs 3,197.

Click to view the interactive map on Constituency Check.
Correction: An earlier version of this story erroneously said the figure for average expenses per hospitalisation, excluding delivery, does not represent the cost of medical services. We regret the error.
(Madhavapeddi is news editor, FactChecker.in.)
We welcome feedback. Please write to respond@indiaspend.org. We reserve the right to edit responses for language and grammar.