Rajasthan Power Losses Up 10 Times During Congress Term: Jaitley Is Right
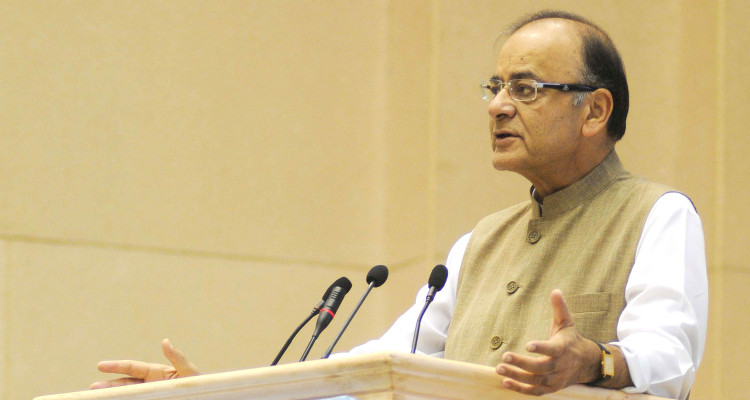
“When Vasundhara Raje lost power in 2008, the Rajasthan Electricity Board was in good shape. Between 2008 and 2013 the crisis developed and now it is the responsibility of the present government to reverse the discredit. So those who are in power between 2008 and 2013 had to realise that the state doesn't come to an end when they go out of power.” – Arun Jaitley, Finance Minister of India.
Last month, Jaitley blamed Rajasthan’s previous government—run by the Congress party—for the state’s power crisis.
Fact Checker found that the financial situation of the Rajasthan Electricity Board and associated utilities worsened significantly between financial year (FY) 2005 and FY2007 and FY2011 and FY2013, the periods mentioned by Jaitley. The losses of the board went up almost ten times over this period.
- From FY2011-FY2013, Rajasthan was one among four states (Rajasthan, Uttar Pradesh, undivided Andhra Pradesh and Tamil Nadu) that together account for nearly three-quarters of the losses of all state utilities [1]. There is no such trend evident in earlier years, from FY2005-FY2007.
- During FY2013, Rajasthan lost Rs 14,855 crore (without subsidy) on sale of electricity. For the two preceding years, the loss was more than Rs 20,000 crore. Compared to these, the pre-subsidy losses in FY2005-FY2007 period were in the range of Rs 2,000 crore, or a tenth, as we detail below:
| Pre-Subsidy Losses On Electricity Sale In Rajasthan | ||
|---|---|---|
| Year | Profit/Loss without subsidy (Rs crore) | Profit/Loss without subsidy as % of Revenue |
| FY2005 | -2,037 | 37.5% |
| FY2006 | -1,651 | 25.5% |
| FY2007 | -1,744 [2] | 24.8% [3] |
| Year | Profit/Loss without subsidy (Rs crore) | Profit/Loss without subsidy as % of Revenue |
|---|---|---|
| FY2011 | -22,586 | 204.6% |
| FY2012 | -21,715 | 164.1% |
| FY2013 | -14,855 [4] | 85.3% [5] |
Source: Power Finance Corporation
- Moreover, during FY2007, the pre-subsidy loss of Rajasthan was 24.8% of its revenues. This means for Rs 1 collected from customers, the state lost 25 paisa. During FY2011, this number was more than 200%: The state lost Rs 2.04 for every rupee it collected as bills from its customers. The figure had come down to 85% in FY2013, but is substantially way higher than past numbers.
- During FY2007, the three utilities selling electricity in Rajasthan charged between Rs 2.04 and Rs 2.32 per unit, which was 35 to 69 paisa per unit lower than the cost of electricity [6]. During FY2013, this gap between cost and revenue ranged from Rs 2.34-2.94 per unit [7].
- During FY2006, agriculture accounted for 33% of electricity consumed and 16% of the revenues in Rajasthan [8]. During FY2013, agriculture consumed 43% of all electricity, and yielded no more than 21% of the revenues [9].
Why did this happen?
A 2012 news report in India Today lists some possible reasons, although these could not be independently verified. According to this story, the Ashok Gehlot government announced a five-year moratorium on electricity tariffs to agriculture ahead of elections and purchased electricity at high prices.
In a more recent development, Rajasthan is reportedly planning to adopt the Gujarat model of electricity reforms. Gujarat has one of the few state sector utilities in India that are not incurring heavy losses. Rajasthan’s power distribution companies have a combined debt of Rs 80,000 crore--of which Rs 52,000 crore was incurred from 2008-13, said this report in Business Standard.
The documents used to verify these reports are available here:
1) The Performance of State Power Utilities for the years 2010-11 to 2012-13
2) Report on the Performance of The State Power Utilities for the Years 2004-05 to 2006-07
Notes:
[1] Page viii, The Performance of State Power Utilities for the years 2010-11 to 2012-13, PFC
[2] Annexure 1.5.1, 1.5.2 & 1.5.3 of Report on the Performance of The State Power Utilities for the Years 2004-05 to 2006-07, PFC
[3] Annexure 1.5.4, 1.5.5 & 1.5.6 of Report on the Performance of The State Power Utilities for the Years 2004-05 to 2006-07, PFC
[4] Annexure 1.5.1, 1.5.2 & 1.5.3 of The Performance of State Power Utilities for the years 2010-11 to 2012-13, PFC
[5] Annexure 1.5.4, 1.5.5 & 1.5.6 of The Performance of State Power Utilities for the years 2010-11 to 2012-13, PFC
[6] Annexure 1.6.3, Report on the Performance of The State Power Utilities for the Years 2004-05 to 2006-07, PFC
[7] Annexure 1.6.3, The Performance of State Power Utilities for the years 2010-11 to 2012-13, PFC
[8] Page xiii, Report on the Performance of The State Power Utilities for the Years 2004-05 to 2006-07, PFC
[9] Page 5-iii, The Performance of State Power Utilities for the years 2010-11 to 2012-13, PFC
Image Credit: Press Information Bureau