100 Million Jobs Created: BJP Minister. Data Show Job Losses
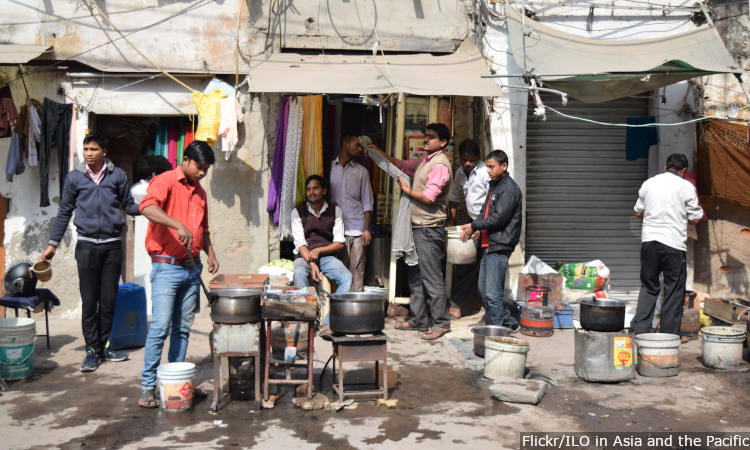
Bengaluru: As the first phase of polling of the 17th Lok Sabha elections got under way on April 11, 2019, Union Minister Dharmendra Pradhan claimed the incumbent Bharatiya Janata Party (BJP) government created 100 million jobs, contrary to leaked data from the National Sample Survey Office that showed unemployment during 2017-18 at a 45-year high of 6.1%.
WATCH | "We have created more than 10 crore jobs": Union Minister @dpradhanbjp’s startling claim Full show here: https://t.co/yCVJpUUoVC@OnReality_Check pic.twitter.com/RQDFpHhocQ
— NDTV (@ndtv) April 10, 2019
While official data from the Periodic Labour Force Survey (PLFS) 2017-18 are awaited, the analysis of Consumer Pyramids Survey by the business informatics provider Centre for Monitoring the Indian Economy (CMIE-CPDX), which is the only source of household employment data for this period, reveals that:
- Five million male jobs were lost between 2016-18, the decline coinciding with demonetisation in November 2016, although no direct causal relationship can be established based only on these trends.
- Unemployment, in general, has risen steadily post 2011 (15%-16% among the higher educated). All household surveys available--the Labour Bureau’s Employment Unemployment Survey (LB-EUS), the Periodic Labour Force Surveys (PLFS), and CMIE-CPDX--point to this.
- India’s unemployed are mostly the higher educated and the young.
- In addition to rising open unemployment among the higher educated--when people are looking for work but no jobs are available--the less educated (and likely informal workers) have also seen job losses and reduced work opportunities since 2016.
- Women are much worse affected than men. They have higher unemployment rates as well as lower labour force participation.
Contested statistics
India’s labour statistics system has been under a cloud as it transitions from the five-yearly employment-unemployment surveys conducted by the National Sample Survey Organisation (NSSO), the last of which was in 2011-12, to the higher frequency, quarterly and annual Periodic Labour Force Surveys (PLFS). A pilot PLFS was conducted in 2012-13 while a first full survey was carried out in 2017-18.
At the same time, the Labour Bureau (under the Ministry of Labour and Employment, and distinct from the NSSO) conducted annual household surveys from 2009-10 to 2016-17 and published the results until 2015-16.
The current Bharatiya Janata Party-led government has not released the results of the last Labour Bureau survey (2016-17), nor the results of the PLFS, both of which have been cleared by the authorities concerned for public release.
However, the Indian labour market has been undergoing rapid changes over the last decade. This, together with major policy changes such as demonetisation and the introduction of the Goods and Services Tax (GST), have greatly increased the importance of jobs numbers for the 2016-2018 period.
Instead of releasing household-level data on employment, the government has released sector-specific data such as the Employees’ Provident Fund Organisation (EPFO) database and the Micro Units Development and Refinance Agency (MUDRA) database. Such administrative databases have the advantage of being high-frequency and free from respondent/surveyor bias (if recorded accurately).
But these data do not cover the entire labour force. The EPFO database, for example, has a stock of around 65 million workers, while the entire workforce is estimated at seven times that, 450 million. Thus, increases in jobs in these databases may be overwhelmed by decreases elsewhere. For an economy like India, which still employs the majority of its workers via informal contracts, the net picture may be completely different from what is visible in the administrative data.
In the absence of official numbers from the PLFS, we use the CMIE-CPDX to understand the employment situation going into the 2019 general election. This nationally representative survey covers about 160,000 households and 522,000 individuals and is conducted in three ‘waves’, each spanning four months, beginning from January of every year. An employment-unemployment module was added to this survey in 2016.
Since the survey questionnaire is different from NSSO, Labour Bureau and Periodic Labour Force Survey, we conducted a detailed study of the comparability of the CMIE-CPDX survey with the Labour Bureau’s and the NSSO’s. The results are reported in the 2019 State of Working India report.
We found these surveys comparable for men but much less so for women, possibly because women tend to have less regular employment and hence their status is sensitive to the way in which questions are asked or to the exact definition of employment. The following section contains analyses only for the male labour force.
The principal point that emerges from the analysis of CMIE-CPDX data is that around 5 million male jobs were lost between 2016 and 2018. And the rate of unemployment increased, as the following section shows.
Employment scenario since 2016
The CMIE-CPDX data present the trends in the male labour force and workforce participation rates in rural and urban areas (Figure 1). The ‘labour force’ refers to all those of working age who are either working or seeking work. The ‘workforce’ refers to all those of working age who are working.
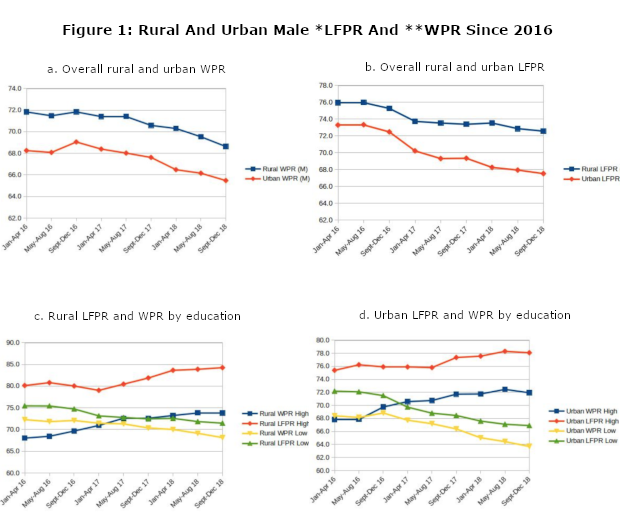
*Labour force participation rate **Workforce participation rate Source: Authors’ calculations based on CMIE-CPDX unit-level data.
The labour force participation rate (LFPR) started to decline from the third ‘wave’ of 2016 (covering the period September to December 2016) for both urban and rural men. The rate of decline slowed down by the second wave of 2017, but the general trend has continued and there has been no recovery.
The timing of the start of the decline is concomitant with demonetisation in November 2016, although a causal link cannot be ascribed based only on these trends.
Workforce participation rate follows a similar trend, though the rate of decline is not as sharp as for LFPR.
Between the third wave of 2016 and the third wave of 2018, the urban male workforce participation rate (WPR) fell by 3.6 percentage points from 69.1% to 65.5%.
For the same period, the rural male WPR fell by 3.2 percentage points from 71.8% to 68.6%. All India (rural and urban) male WPR fell by 3.3 percentage points in this period.
How many jobs were lost
To determine how many jobs were lost, the growth in the size of the working age population during this period would have to be taken into account. The male working-age population in India increased by 16.1 million to 491 million between 2016 and 2018, according to United Nations’ Department of Economics and Social Affairs (UN DESA) 2017 data. Accounting for the increase in working-age population, the decline in the WPR amounts to a net loss of 5 million jobs during this period. If a similar analysis were to be performed for women, for whom also the WPR has fallen, the number of jobs lost would be higher.
Broadly, these trends can be interpreted as saying that the proportion of working-age men who are in employment continues to go down. This is the opposite of what one would expect with the ‘demographic dividend’ where the ratio of the working age group to the rest of the population increases, thus spurring higher growth. Whether or not this decline was caused by demonetisation, it is definitely a cause for concern and calls for urgent policy intervention.
The decline in LFPR and WPR has affected men with different educational backgrounds differently.
Figures 1c and 1d show the disaggregated trends by education levels. The ‘high education’ group consists of men with a diploma or degree beyond Class 12. The decline in LFPR and WPR is driven by men with lower education levels, for both rural and urban areas. For example, in the third wave of 2016 (September to December), the WPR for men with high as well as low levels of education in urban areas was similar (69.8 and 68.8, respectively), but in the third wave of 2018, the WPR for higher educated men had increased to 71.9% while that for less educated men had fallen to 63.7%.
This is consistent with the idea that the sector that was hit the hardest by demonetisation as well as the introduction of GST was the informal sector, where we can assume that the share of less educated men would be higher. One question that may arise is, how can informal workers afford to remain out of the labour force? The answer may lie in the fact that a lower WPR does not necessarily mean a given person is fully out of work. Rather, it can be a result of the fact that work has become less regularly available, leading to a lower probability that the individual will be counted as part of the workforce in a survey.
A final point to note in Figures 1c and 1d is that the gap between the LFPR and WPR is much higher for higher educated than for the less educated. This indicates that the levels of open unemployment are higher among the educated.
Thus two clear policy interventions are needed for two distinct challenges: reducing open unemployment among the higher educated and bringing back the less educated into the workforce.
Extent of unemployment
The recently leaked PLFS data as well as several other anecdotal pieces of evidence suggest that open unemployment has been increasing in India. This is particularly true of the educated young.
Both the PLFS and the CMIE-CPDX report the overall unemployment rate to be around 6% in 2018, double of what it was in the decade from 2000 to 2011. After remaining at around 2-3% for the first decade of the 21st century, the unemployment rate has steadily increased to around 5% in 2015 and then just over 6% in 2018.
Overall unemployment is likely to be driven by what is happening to the educated section of the labour force. This is because it is this section which tends to aspire to a regular, formal sector job, and will report as unemployed and look for work rather than working at any available job in the informal sector.
Table 1 shows that during this period, while overall unemployment rate was 3%, the rate among the educated was 10%. From 2011 it increased to around 15-16%.
| Table 1: Unemployment Rate Overall Versus The Higher Educated For The Past Two Decades | |||||||
|---|---|---|---|---|---|---|---|
| Overall Unemployment Rate | |||||||
| NSSO 55th | NSSO 61st | NSSO 68th | Labour Bureau | Labour Bureau | Centre for Monitoring the Indian Economy | Centre for Monitoring the Indian Economy | |
| 1999-2000 | 2004-05 | 2011-12 | 2011-12 | 2015-16 | 2016 | 2018 | |
| Overall | 3 | 3.1 | 2.7 | 3.8 | 5 | 8.2 | 6 |
| Male | 3 | 2.7 | 2.4 | 2.9 | 4 | 5.5 | 4.9 |
| Female | 2.4 | 4.15 | 3.7 | 6.9 | 8.7 | 22.4 | 14.2 |
| Unemployment Rate among Educated (Degree/Diploma beyond Class 12) | |||||||
| Overall | 10.3 | 10.7 | 10.3 | 9 | 15.2 | 16.3 | 12.7 |
| Male | 8.4 | 7.5 | 8.4 | 5.9 | 11.4 | 12.05 | 9.7 |
| Female | 21.1 | 24.3 | 21.3 | 25.8 | 30.6 | 40.1 | 34.1 |
Source: Reports of the NSS-EUS and LB-EUS, various years. Authors’ calculations from CMIE-CPDX unit-level data.
Both overall unemployment as well as unemployment among the educated tends to be much higher for women compared to men.
If educated Indians are more likely to be unemployed than uneducated ones, more educated Indians would be found among the unemployed than their share in the general population. For example, we may find that graduates are only 10% of the population but one-third of the unemployed. This gives us a measure of over- or under-representation.
Thus we find that among rural men, graduates are around 7% of the working age population but over 20% of the unemployed, giving a representation index of 3.3.
Among urban women, graduates are 10% of the working age population but 34% of the unemployed, giving a representation index of 3.4. Among rural women, graduates form only a small 3.2% of the working age population, but make up 24% of the unemployed (representation index = 7.4). Beyond this age group, particularly for women, the 25-34 years group is also over-represented among the unemployed.
Broadly speaking, open unemployment in India today is most acutely a concern for those under 35 years of age and those who are educated beyond Class 10, and particularly beyond Class 12.
The age group 20-24 years is hugely over-represented. Among urban men, for example, this age group accounts for 13.5% of the working age population but 60% of the unemployed.
To conclude, the Indian economy appears to be dealing with two urgent challenges. The challenge of open unemployment among the educated youth has received attention in the media as well as policy circles.
The second challenge is of making regular work available to the less educated informal workers--millions of whom have been rendered jobless in recent years, as IndiaSpend has reported in its series here, here, here, here, here and here. Since it concerns many more workers, numerically, it calls for urgent policy interventions.
In our study, we recommend a strengthening of the Mahatma Gandhi National Rural Employment Guarantee Scheme, and an extension of the employment guarantee to urban areas.
(Shrivastava and Basole teach Economics at Azim Premji University, Bangalore. Abraham is a post-doctoral fellow at Azim Premji University's Centre for Sustainable Employment.)
We welcome feedback. Please write to respond@indiaspend.org. We reserve the right to edit responses for language and grammar.